Treydly Chart: The Best Free Footprint Trading App
Treydly Chart is a completely free, real-time footprint charting desktop app that turns raw trade data into a pure order-flow view of the market.
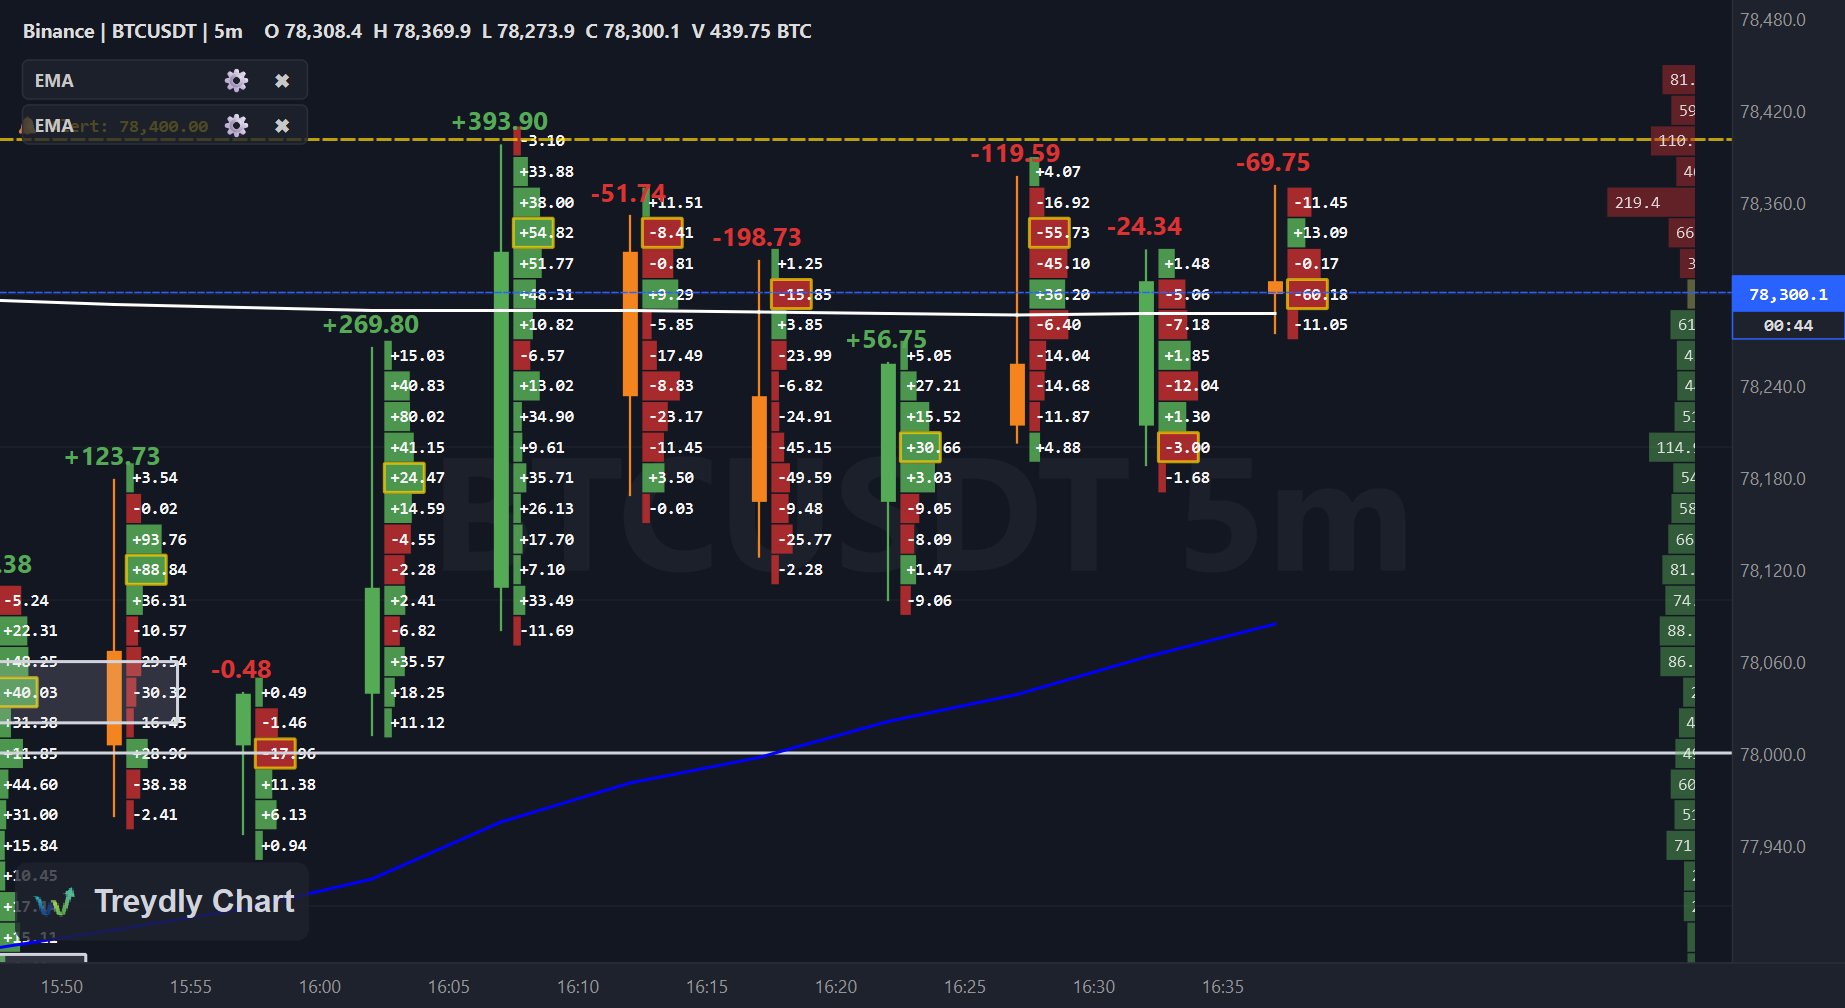
If you are trading using standard candlestick charts, you are essentially trading blindfolded. You see the open, high, low, and close, but you have no idea what actually happened inside that price action.
Enter Treydly Chart: a completely free, real-time footprint charting desktop app that turns raw trade data into a pure order-flow view of the market. It doesn't just show you what the price did; it shows you exactly who was in control at every single price level.
Here is your complete guide to setting up and dominating the markets with Treydly.
Beyond the Candlestick: Why Footprint Matters
Standard charts give you a summary; Treydly gives you the receipt. By connecting directly to the Binance Futures WebSocket, Treydly groups every individual trade by price level and automatically separates them into aggressive buys and aggressive sells (based on whether the taker crossed the spread).
When you look at a Treydly footprint candle, you unlock critical advantages:
- True Delta: See the actual buy/sell imbalance at a glance, stripping away the illusion of a simple "green" or "red" candle.
- Point of Control (POC): Instantly spot the exact price level within a single candle where the highest volume was transacted.
- Imbalance Cells: Visually highlight specific price pockets where one side dominated the other by a massive, lopsided ratio.
- Cumulative Volume Delta (CVD): Track the running net buying or selling pressure to spot when the market is running out of steam.
Pro Tip: Stop guessing if a breakout is real. Use Treydly's footprint delta and CVD divergence to verify if aggressive market orders are actually supporting the price movement, or if it is just a low-volume trap.
Spotting the Whales with DOM and Alerts
Order flow isn't just about what has happened; it is about what is waiting to happen. Treydly brings institutional-grade liquidity tracking to your desktop.
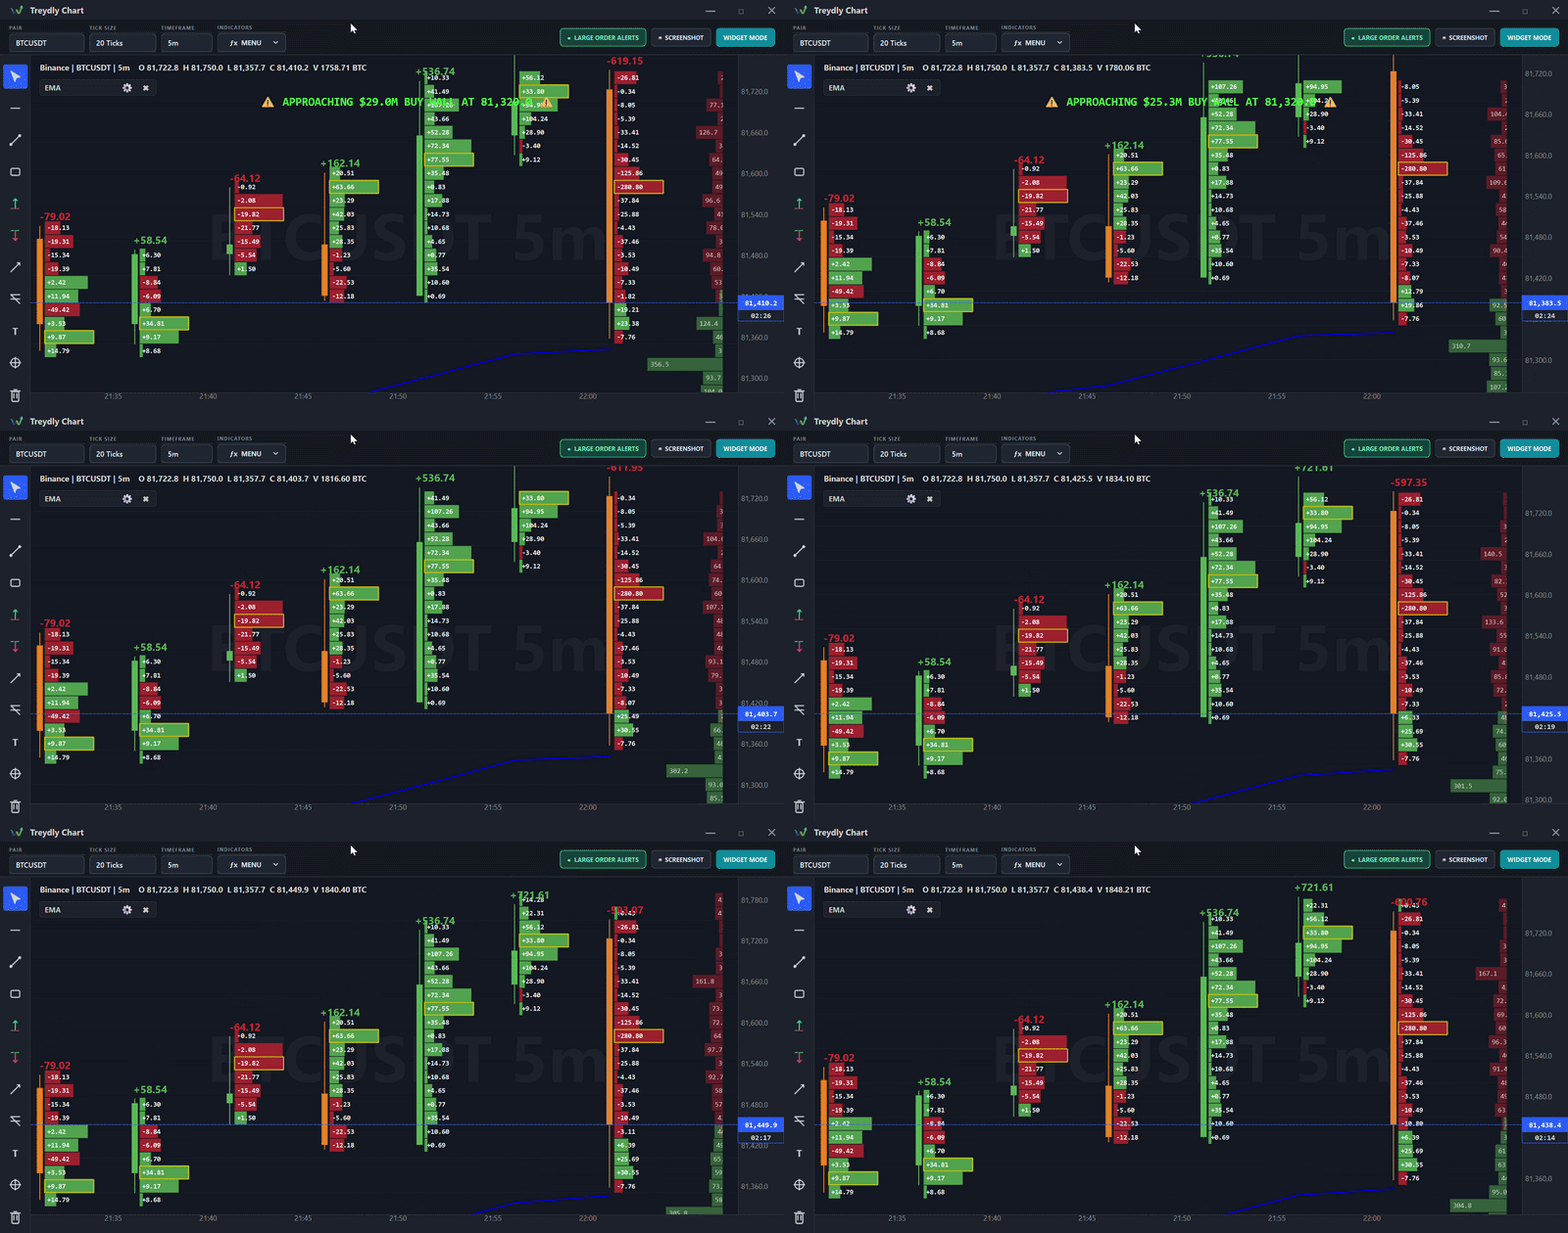
- Real-time DOM (Depth of Market): Watch the Level-2 order book live. Treydly displays a dynamic ladder with bid/ask bars and precise size labels so you can see exactly where the liquidity is resting.
- Whale-Wall Alerts: You don't have to stare at the screen all day. Treydly features visual on-screen and audio alerts that trigger the moment massive "$M" order walls step up near the active price.
Your Complete Analysis Toolkit
Treydly is built to adapt to your trading style, packing a full suite of traditional analysis tools right alongside its advanced order flow mechanics.
| Feature Category | What's Included |
|---|---|
| Volume & Flow | Session Volume Profile, Session VWAP, CVD, Delta Divergence, and Imbalance Overlays. |
| Technical Indicators | SMA, EMA, RSI, MACD, Bollinger Bands, and Volume Profile. |
| Precision Drawing | Trendlines, Horizontal Lines, Rectangles, Rays, Text, and Fibonacci retracements. |
| Trade Planning | Fixed Range Volume Profile (FRVP) and Long/Short risk-reward boxes to map out your entries and exits. |
| Quality of Life | Right-click audio price alerts, screenshot watermarking, and an always-on-top Widget Mode for seamless multi-tasking. |
Trading with order flow can feel like learning a new language, but once you learn to read the footprint, looking at standard candles will never feel the same.
For short-term cryptocurrency day traders, footprint (or cluster) charts are incredibly useful because they provide an "X-ray vision" look inside standard candlesticks. Instead of just showing the high and low, they reveal the exact volume of aggressive market buyers and sellers battling at every specific price level. [1, 2]
The Treydly Chart holds its own against heavy hitters by offering specialized features tailored for crypto. To help you determine if it outclasses other software, consider this direct comparison: [1]
📊 Treydly Chart vs. Industry Giants
| Platform | Core Focus | Pricing | Is Treydly Better? |
|---|---|---|---|
| Treydly Chart | Crypto Footprint & Order Flow | 100% Free (Windows Beta) | Yes, for cost & simplicity. It provides high-end tools (CVD, whale walls, order book depth) for $0. |
| Sierra Chart | Professional Futures | ~$36/month + data fees | No for infrastructure, Yes for ease-of-use. Sierra Chart is the industry standard for speed, but it is notoriously hard to set up. Treydly works out of the box. |
| Quantower | Multi-asset & Crypto | $70/month or $1,590 lifetime | No for flexibility. Quantower is incredibly polished and supports advanced APIs. Treydly is better only if you want a free, dedicated crypto tool. |
| ATAS | Order Flow / Clusters | ~$85/month | No for depth. ATAS is an elite institutional platform. Treydly is an excellent lightweight, free alternative for retail traders. |
| TradingView | Retail Charting | ~$70/month (for high tiers) | Yes for footprint. TradingView is not built natively for pure footprint analysis. Treydly's engine displays order flow far more clearly than TradingView scripts. |
✨ Where Treydly Chart Wins (The Advantages)
- Zero Cost: Professional order-flow platforms usually cost $40 to $100 a month before you even purchase exchange data feeds. Treydly provides these complex cluster metrics entirely free. [1, 2]
- Built-In "Whale Wall" Detection: It includes a live Depth of Market (DOM) ladder that tracks massive resting limit orders on crypto exchanges and flashes visual/audio warnings when the price approaches them. [1]
- Native Crypto Integration: Many legacy platforms (like Sierra Chart or NinjaTrader) require complex bridge connections to get accurate crypto data. Treydly is coded specifically for digital asset pairs like BTCUSDT right from the start. [1, 2, 3]
💡 The Verdict
If you trade crypto and want to learn footprint strategies without paying a steep monthly software fee, Treydly Chart is arguably better than its competitors purely on value. If you are a professional futures trader who requires maximum execution speed, traditional platforms like Sierra Chart or ATAS remain superior. [1, 2]
Track this in Treydly — free
Connect your MT5, MT4, or cTrader account, import your trade history, get all your statistics instantly.
Create Free Account