See aggressive ask and bid volume in each price bin, colored by net direction with delta text.
Free Windows Beta
Treydly Chart — Free Crypto Footprint & Order Flow Charting
Analyze crypto market structure with real-time footprint charts, CVD, volume profile, Level 2 order book data, delta, and imbalances.
Download Treydly Chart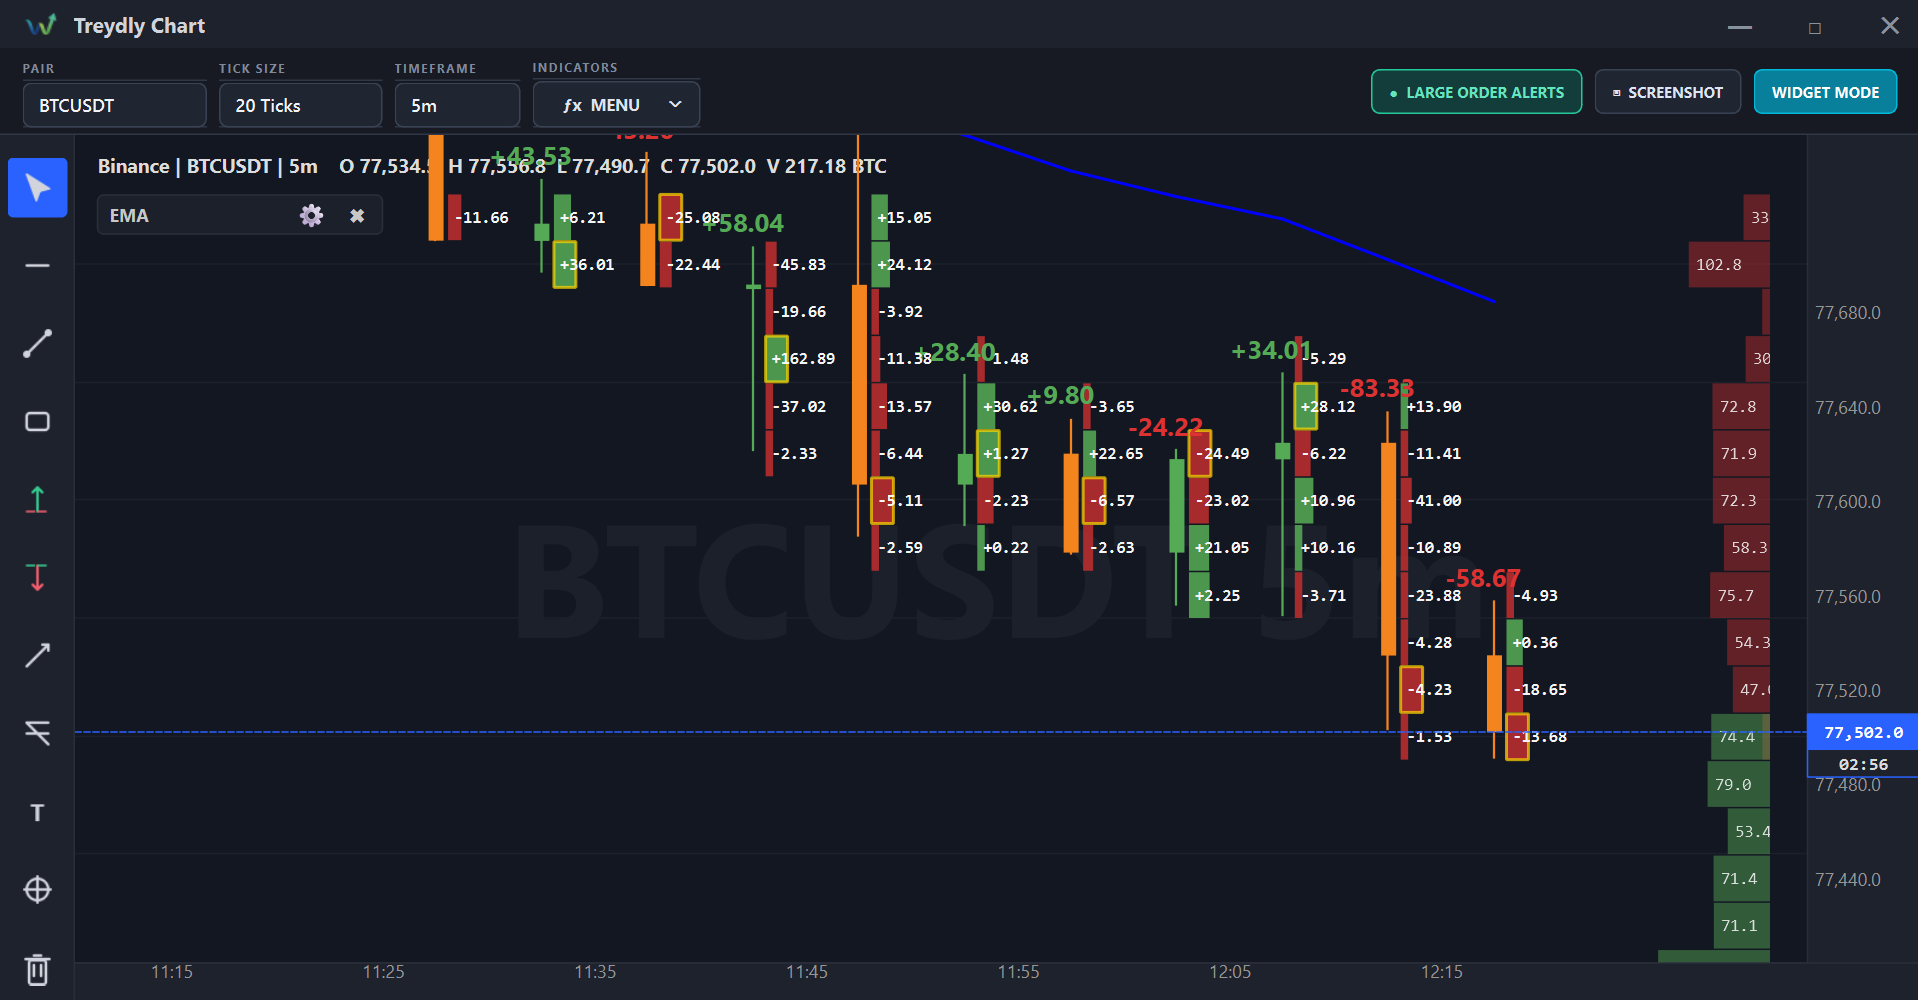
Crypto Footprint Charts & Order Flow
Order flow, made visible.
Treydly Chart is built around the details that explain crypto market behavior, from intra-candle pressure to live Level 2 depth.
Highlight the highest-volume Point of Control with a gold border and display net candle delta above each candle.
Detect diagonal buying and selling imbalances, with distinct visual borders for each direction.
Footprint clusters collapse into standard candles as you zoom out to keep the chart legible.
Read Level 2 depth at the chart edge with green bid bars, red ask bars, and size labels.
Monitor large crypto orders, flash proximity warnings, play audio alerts, and toggle detection from the header.
Charting Indicators & Position Tools
More than the candle.
A complete crypto analysis workspace for traders who need order flow, momentum, drawing, and alert context in one place.
CVD line and histogram with daily reset, price-versus-CVD divergence markers, Session Volume Profile, and Session VWAP.
Bollinger Bands, RSI, MACD with histogram, plus 20-period SMA and EMA.
Pointer, horizontal line, trendline, ray, rectangle, Fibonacci, text annotation, and fixed-range volume profile tools.
Long and short projections with Entry, Take-Profit, Stop-Loss handles, colored zones, and a live R:R badge.
Right-click price alerts, crossing notifications, drawing restoration, and per-symbol settings persistence.
Crypto Market Structure Analysis
Read the story behind the move.
Crypto market structure is easier to interpret when price, volume, and execution flow are visible together.
Treydly Chart renders aggressive buyers and sellers inside every footprint candle, then adds the context around them: Point of Control, candle delta, diagonal imbalances, and adaptive zoom behavior. The result is a chart that shows both the move and the pressure behind it.
On the right edge, the live DOM ladder shows resting bid and ask depth. Whale wall proximity detection watches large resting orders by symbol and can warn you when price approaches a major wall with flashing visual and audio alerts.
Under the chart, CVD, divergence, volume profile, VWAP, RSI, MACD, Bollinger Bands, SMA, and EMA provide multiple ways to test the same market story. The left drawing suite adds levels, zones, Fibonacci studies, range profiles, and long/short risk-to-reward planning.
Everything is designed for crypto pairs and real-time workflow: load history, store footprint data locally, update as trades arrive, customize indicators safely, and restore drawings and alerts per symbol.
Get the betaDownload when
Download when
you are ready.
No login. No activation key. Your email is used for the download request only unless you separately opt into product updates.
Marketing emails include a one-click unsubscribe link.Install with
clear expectations.
The beta is intentionally lightweight, but it is still desktop software installed into Program Files and may require normal Windows permission.
Installation
- Download the installer and open
TreydlyChart_Installer.exe. - Allow the standard Windows UAC prompt and choose the install location.
- Launch Treydly Chart from the Start menu and begin charting.
SmartScreen note: Windows may show a warning because the beta installer is not code-signed yet. Verify the published checksum below before running it.
System requirements
- Windows 10 or Windows 11, 64-bit
- 4 GB RAM minimum; 8 GB recommended
- At least 500 MB available storage
- Internet connection for live market data and alerts
- Normal permission to install into Program Files
Known beta limitations
- Market-data availability and indicator behavior may change.
- Some chart-sharing workflows are still being refined.
- Performance may vary across older integrated graphics hardware.
Quick answers
Clear answers for traders deciding whether the Windows beta fits their crypto workflow.
What is Treydly Chart?
Treydly Chart is a crypto-focused Windows application for footprint clusters, order-flow analysis, volume distribution, market imbalances, and Level 2 depth.
Which markets does it support?
It is designed for crypto pairs, including BTCUSDT, ETHUSDT, and other supported digital-asset markets.
Does it require an account?
No login or activation key is required. An email address is required to request the beta download.
Is it financial advice?
No. Treydly Chart is a market-analysis tool, not financial, investment, or trading advice.
Release notes
Keep the first beta honest. We will expand this log as builds move forward.
0.1.0-beta / Initial beta
- Market chart workspace with indicators
- Price alerts and chart sharing
- Long and short position tools
- Treydly watermark on shared charts
- Windows installer with no login requirement
Checks & support
SHA-256
Publisher checksum will be published with the release notes
Found a problem? Email contact@treydly.com with your Windows version and a short reproduction.