How to Keep a Trading Journal: The Complete Guide for 2026
Learn exactly how to keep a trading journal in 2026. Step-by-step guide covering what to track, how to review your trades, and how journaling improves profitability.

Why a Trading Journal is Non-Negotiable
Professional traders treat their journal the same way a surgeon treats their notes — with precision and consistency. Without a record of your decisions, you are flying blind. A trading journal transforms raw trade data into actionable insight that compounds over time.
The math is simple: if you make 100 trades per month and lose just one repeatable mistake (say, trading within the first 15 minutes of the New York open), eliminating that single pattern could add hundreds or thousands of dollars back into your account. But you can only identify that pattern if you have a record of it.
This guide covers exactly what to record, how to structure your reviews, and how to build a journaling habit that actually sticks.
What to Record in Every Trade
At minimum, log the following for each position:
- Entry date & time — pinpoint your best and worst trading sessions
- Instrument / symbol — discover which assets genuinely suit your style
- Direction — long or short
- Entry price & exit price — the raw numbers, no rounding
- Stop loss & take profit — planned before entry, not adjusted mid-trade
- Position size / lot size — risk per trade in both lots and dollars/%
- Gross P&L and net P&L — gross profit minus commissions and swap
- Setup / strategy name — e.g. “Break & Retest”, “EMA Crossover”, “FVG Fill”
- Pre-trade reasoning — why did you take this trade? Quote your own rules.
- Emotional state — were you anxious, confident, bored, angry?
- Did you follow your trading rules? — yes / no, and which rule if no
- Post-trade review — what went right? what went wrong? what would you do differently?
- Chart screenshot — capture the chart at entry and again at exit
You don’t need all of these from day one. Start with the first six (entry, exit, direction, P&L, setup, size) and add the qualitative fields as journaling becomes routine.
The Right Journal Format: Before, During, and After
Structure each journal entry in three parts:
Before the Trade (Pre-Trade Plan)
Write this before you click buy or sell. Describe:
- What setup you see and why it qualifies under your rules
- Where your stop loss is and why (specific level, not a dollar amount)
- Where your take profit is and your expected R:R
- How much of your account you are risking (in %)
- Your confidence level: 1–10
This prevents hindsight bias. Once a trade is closed, the human brain automatically “remembers” having a reason for it. The pre-trade note is the truth.
During the Trade (Optional, for Longer Positions)
For swing trades held hours or days, note any rule modifications: did you move the stop, reduce position, or add to the trade? Document the reason.
After the Trade (Post-Trade Review)
Within 15 minutes of closing the trade:
- Did the price move as expected?
- Did you follow your plan exactly, or deviate? Why?
- If it was a loss, was it a good loss (correct process, wrong outcome) or a bad loss (broke your rules)?
- What would you do differently next time?
- Add your exit chart screenshot
A good loss followed correctly is fine. A bad loss from rule-breaking is a problem that must be tracked.
Treydly’s journal view — all your trades with P&L, notes, and screenshots in one place.
How to Review Your Journal Weekly
Raw data is only useful if you study it. Set aside 20–30 minutes every Sunday to run through this process:
- Calculate your win rate for the week — number of winning trades ÷ total trades
- Calculate average R:R — average profit on wins ÷ average loss on losses
- Find the 3 best trades and write down exactly what made them work
- Find the 3 worst trades and identify the shared mistake (usually one pattern repeats)
- Check rule compliance — of every trade taken, what % followed your rules exactly?
- Review emotional log — were there any trades taken angry, bored, or after a loss streak?
- Set one focus for next week — specific, e.g. “no trades in the first 30 min of London open”
Most traders skip this step. It’s the most important step. Writing data without reviewing it is the same as not writing it at all.
Monthly Review: Find Your Edge
Once per month, zoom out and look at the bigger picture:
- Which strategies are actually profitable? Filter by setup name and compare win rates.
- Which symbols are you losing on? You may be excellent at EURUSD but consistently lose on GBPJPY.
- Which days of the week are profitable? Chart P&L by day. Many traders find Monday and Friday are their worst days.
- What is your Profit Factor? Gross profit ÷ gross loss. Below 1.0 = net loser. Above 1.5 = solid edge.
- What is your maximum drawdown? The worst peak-to-trough decline. If this exceeds your emotional tolerance, your position sizes are too large.
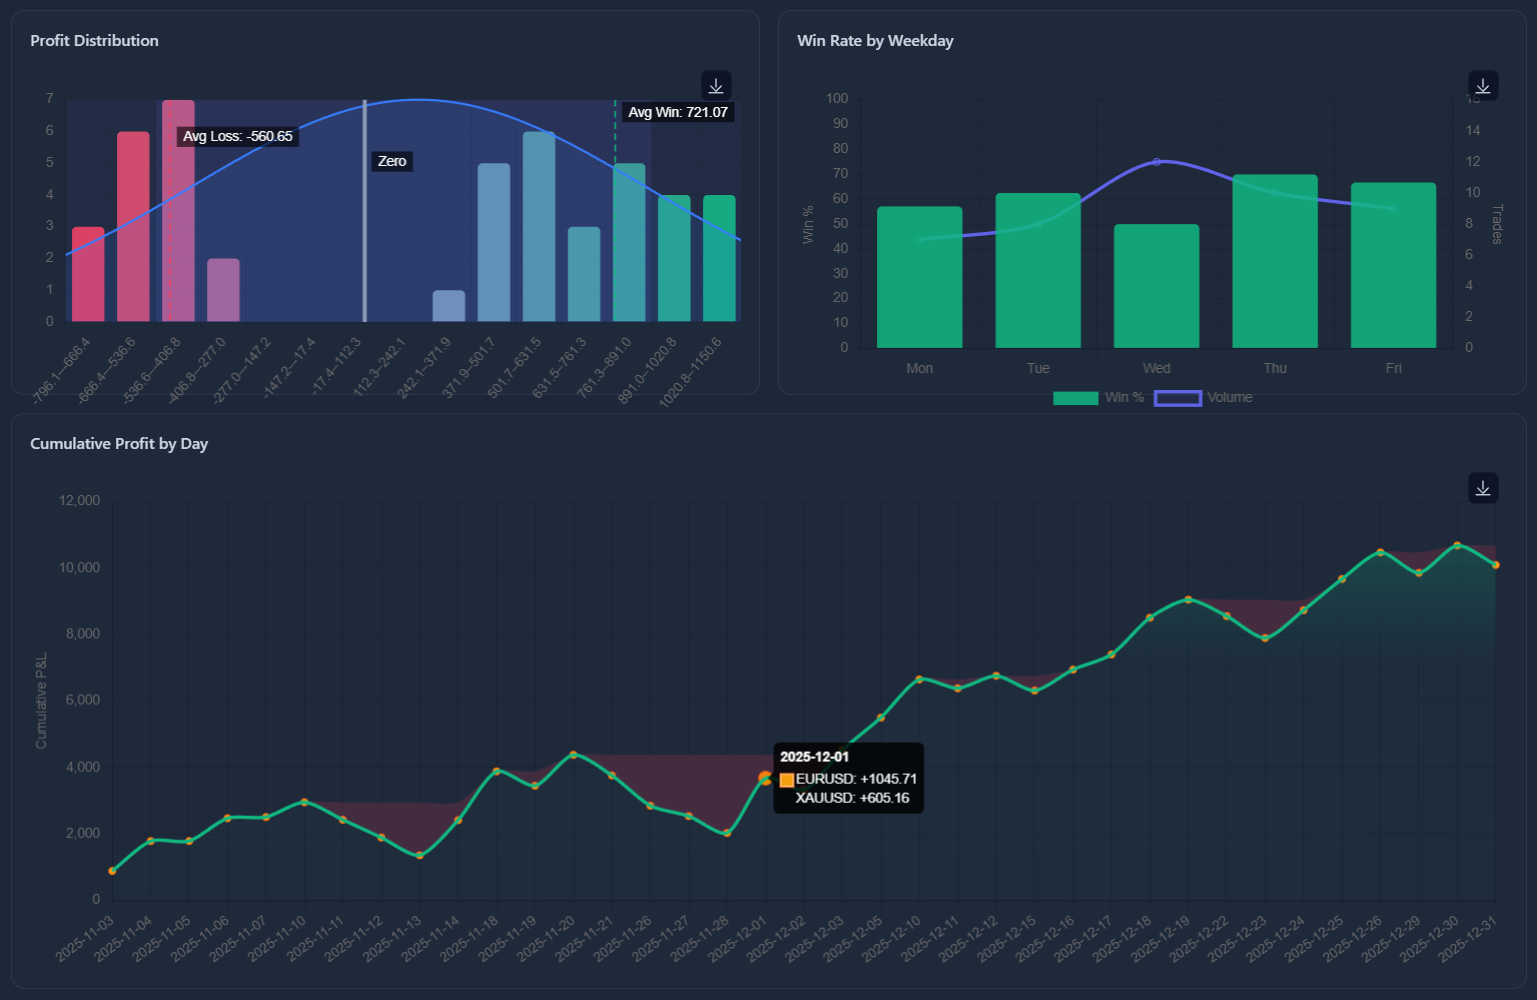
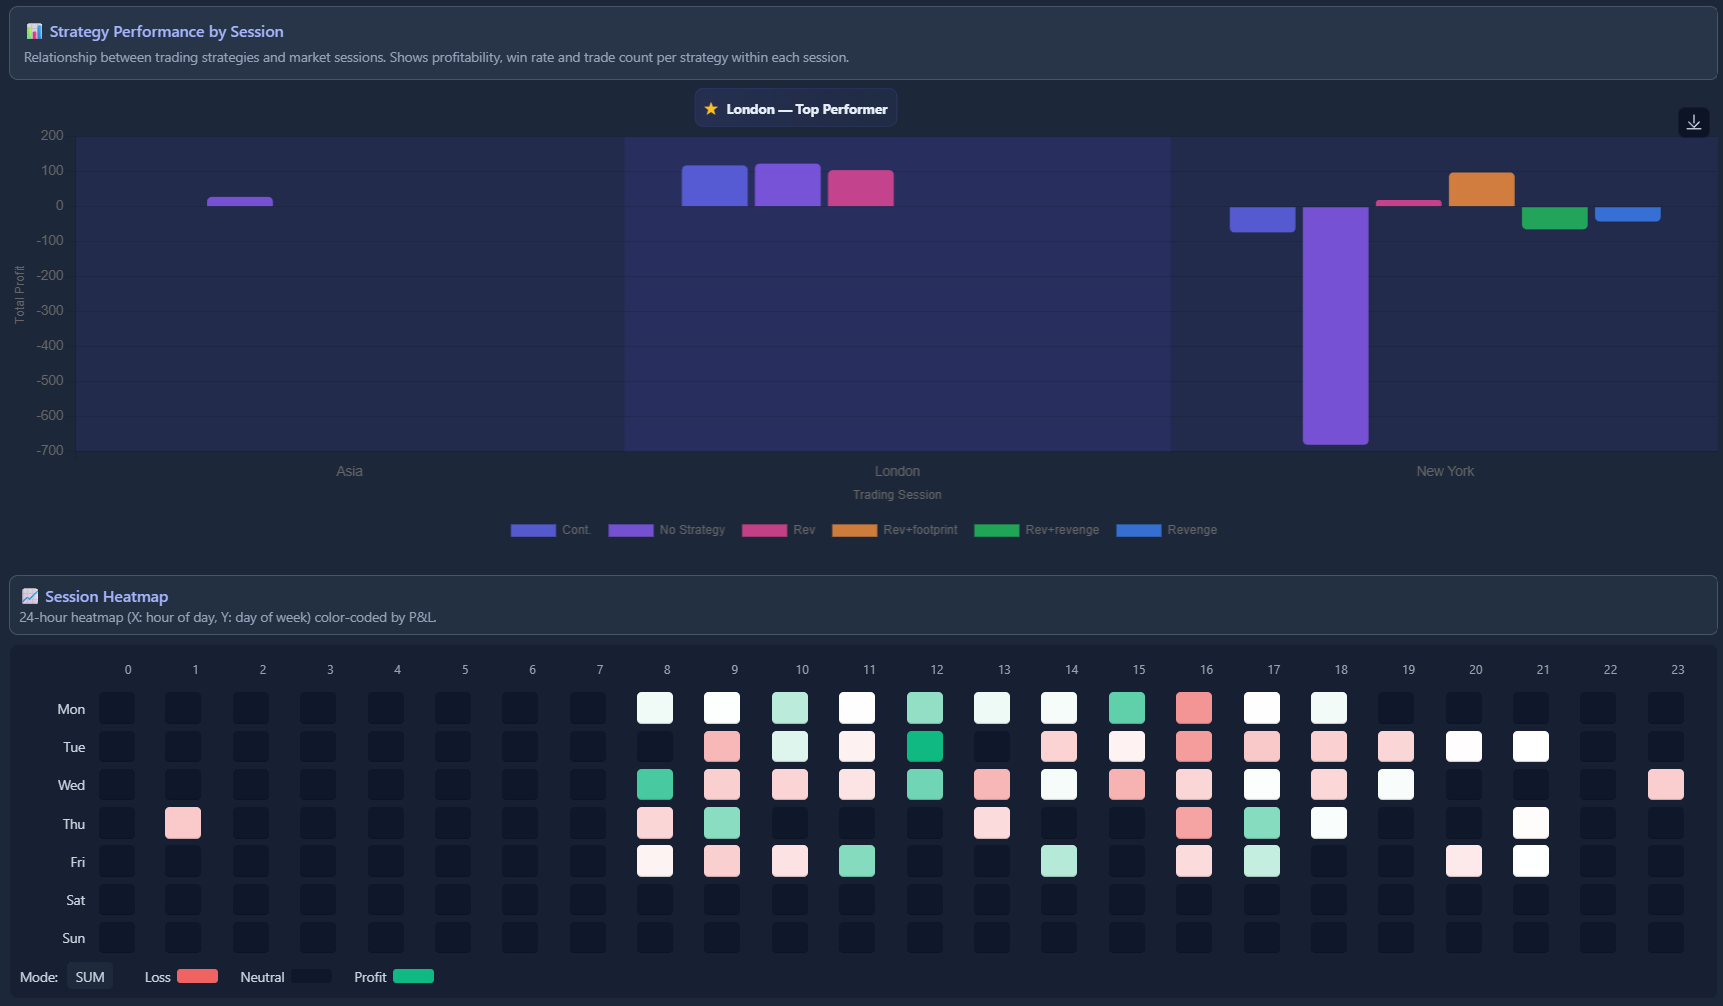
Treydly’s performance analytics — win rate, P&L breakdown, and session heatmaps calculated automatically from your imported trades.
Common Mistakes Traders Make with Their Journal
- Only logging losses — you need winners too, to understand what your edge actually looks like
- Being vague in notes — “looked good” is useless three weeks later. “Price broke above 1.0850 with a bullish engulfing candle on the 4H, aligning with the daily uptrend” is useful.
- Skipping embarrassing trades — the trades you’re most ashamed of are the ones you learn the most from
- Never reviewing the data — a journal you never read is a diary, not an improvement tool
- Changing format constantly — pick a consistent structure and stick with it so data stays comparable
- Logging after the fact — memory distorts. Log pre-trade notes before entry, always.
How to Build a Journaling Habit That Sticks
Most traders start a journal with enthusiasm and abandon it within 3 weeks. Here’s how to avoid that:
- Make it frictionless — the more steps required, the less likely you are to do it. A tool that auto-imports your trades removes the biggest friction point.
- Link it to your trading routine — open your journal before you open your charts, not after. It becomes part of warming up.
- Keep notes short at first — even 2 sentences about each trade is vastly better than nothing.
- Set a calendar reminder for Sunday review — treat it like a meeting you cannot skip.
- Track streak — knowing you’ve logged 14 sessions in a row makes you reluctant to break the streak.
Why Use Treydly Instead of a Spreadsheet?
You can absolutely start with a spreadsheet. But after about two weeks of manually typing every entry price, exit price, lot size, P&L, and commission for every trade, most traders quietly stop doing it.
Here’s what Treydly does differently:
1. Import Your Entire Trade History in Seconds
Export your MT5 report as an HTML file (right-click History tab → Report → Save as HTML). Upload it to Treydly. Every trade — including entry time, exit time, P&L, symbol, commission, and swap — appears instantly. No typing. Treydly also supports MT4 (HTM reports) and cTrader (HTML/XLSX), compatible with brokers including Fusion Markets, Pepperstone, and IC Markets.
2. All Statistics Calculated Automatically
Once imported, Treydly immediately shows you: win rate, average R:R, total P&L, biggest win, biggest loss, Profit Factor, and maximum drawdown. On the Premium plan, you also get: session heatmaps (London vs New York vs Asian), performance by symbol, by day of week, Sharpe ratio, Calmar ratio, and consecutive win/loss streak analysis.
3. Attach Screenshots to Every Trade
Treydly lets you upload chart screenshots directly to individual trades. When you review a trade 3 months later, you see exactly what the chart looked like at entry — not what you think it looked like.
4. Trading Rules Enforcement
Set hard rules in Treydly: maximum trades per day, daily loss limit, maximum position size. Track whether you followed your rules on every trade. The compliance score across a month of data is one of the most revealing numbers any trader can see.
5. AI Coach: Trey (Premium)
Write your daily trading plan — the setups you’re watching, the conditions you require — and ask Trey for feedback. Trey reviews your plan and your completed trades, identifies behavioral patterns, and gives you specific recommendations based on your actual trading data. Not generic advice. Your data.
6. Mood and Psychology Tracking (Premium)
Log your emotional state before each session. Treydly’s Psychology System tracks mood trends and plots them against your P&L. The correlation between emotional state and trade quality becomes impossible to ignore when it’s right in front of you as a chart.
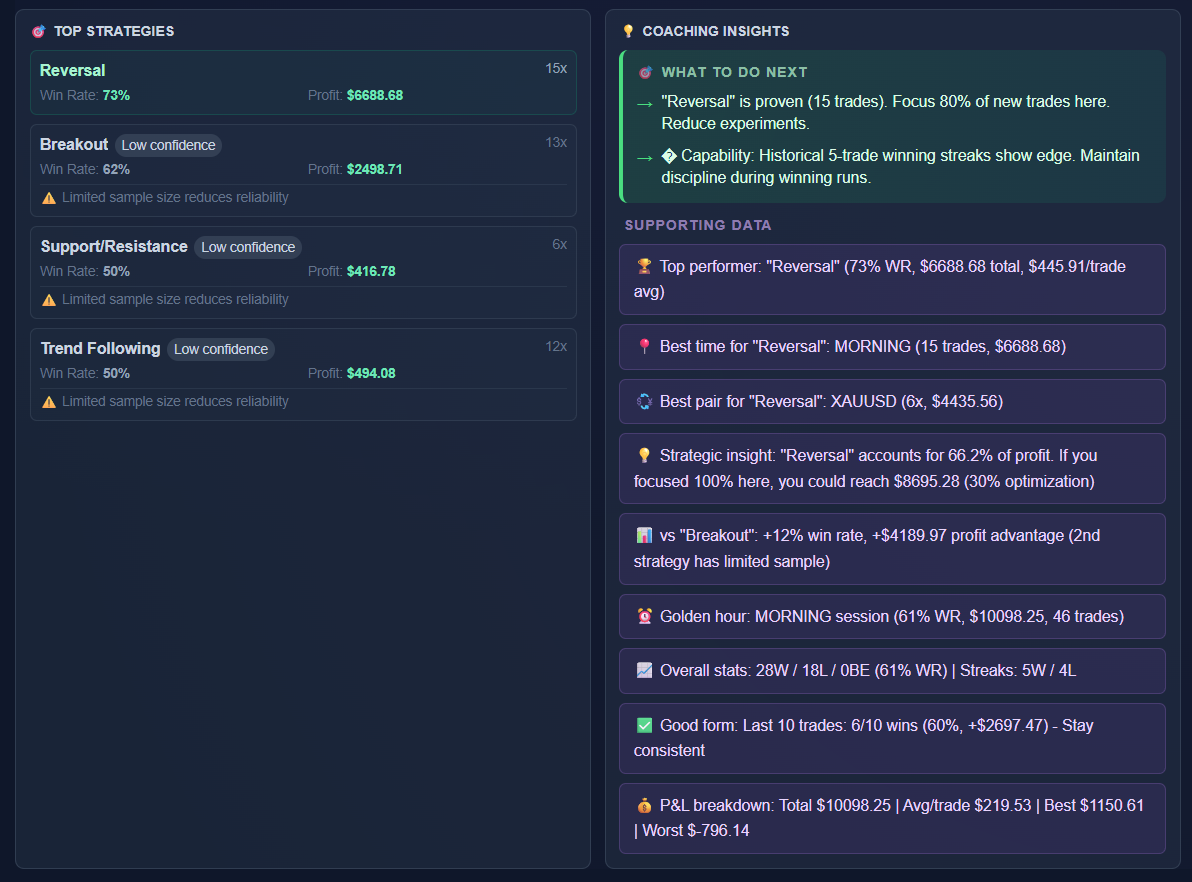
Trey AI analyses your trades and daily plans — available on the Premium plan.
How Much Does Treydly Cost?
Treydly is a paid platform with a 14-day free trial — no credit card required. After the trial, the Premium plan is $9.99/month or $99.90/year (saving ~$20 vs monthly).
The Premium plan includes everything: trade import (MT5, MT4, cTrader, CSV), complete trade log, notes and screenshots, full statistics, advanced analytics, session breakdowns, AI coaching with Trey, mood tracking, and unlimited accounts.
Track this in Treydly — free
Connect your MT5, MT4, or cTrader account, import your trade history, get all your statistics instantly.
Create Free Account